The Efficiency Gap Makes No Sense (but all metrics show Republicans are better at gerrymandering)
Cracking, Packing, and Wasted Votes
The efficiency gap is a technique for measuring the level of gerrymandering in a state. Gerrymandering generally takes the form of what’s known as “cracking and packing.” Cracking is the process of taking a district with a majority of the opposing party and splitting it into two in which the party has a minority in each, thus denying your opponent that seat. However, this isn’t always possible because your opponent might have too many votes in a given area. To reduce the remaining number of votes your opponent has while minimizing the number of seats they have, you can use a technique called packing, in which you create a district in which your opponent can win by a huge margin.
To measure both cracking and packing, we can use the concept of a wasted vote. A wasted vote is any vote that did not contribute to the victory. There are two kinds of wasted votes, cracked waste and packed waste. A cracked wasted vote for party X is any vote in a district party X has lost. A packed wasted vote is any vote for party X over 50% in a district party X has won.
For example, let’s say that there are just two parties1 and 1000 voters in a district. The number of wasted votes for X in terms of the number of votes for X is as such:
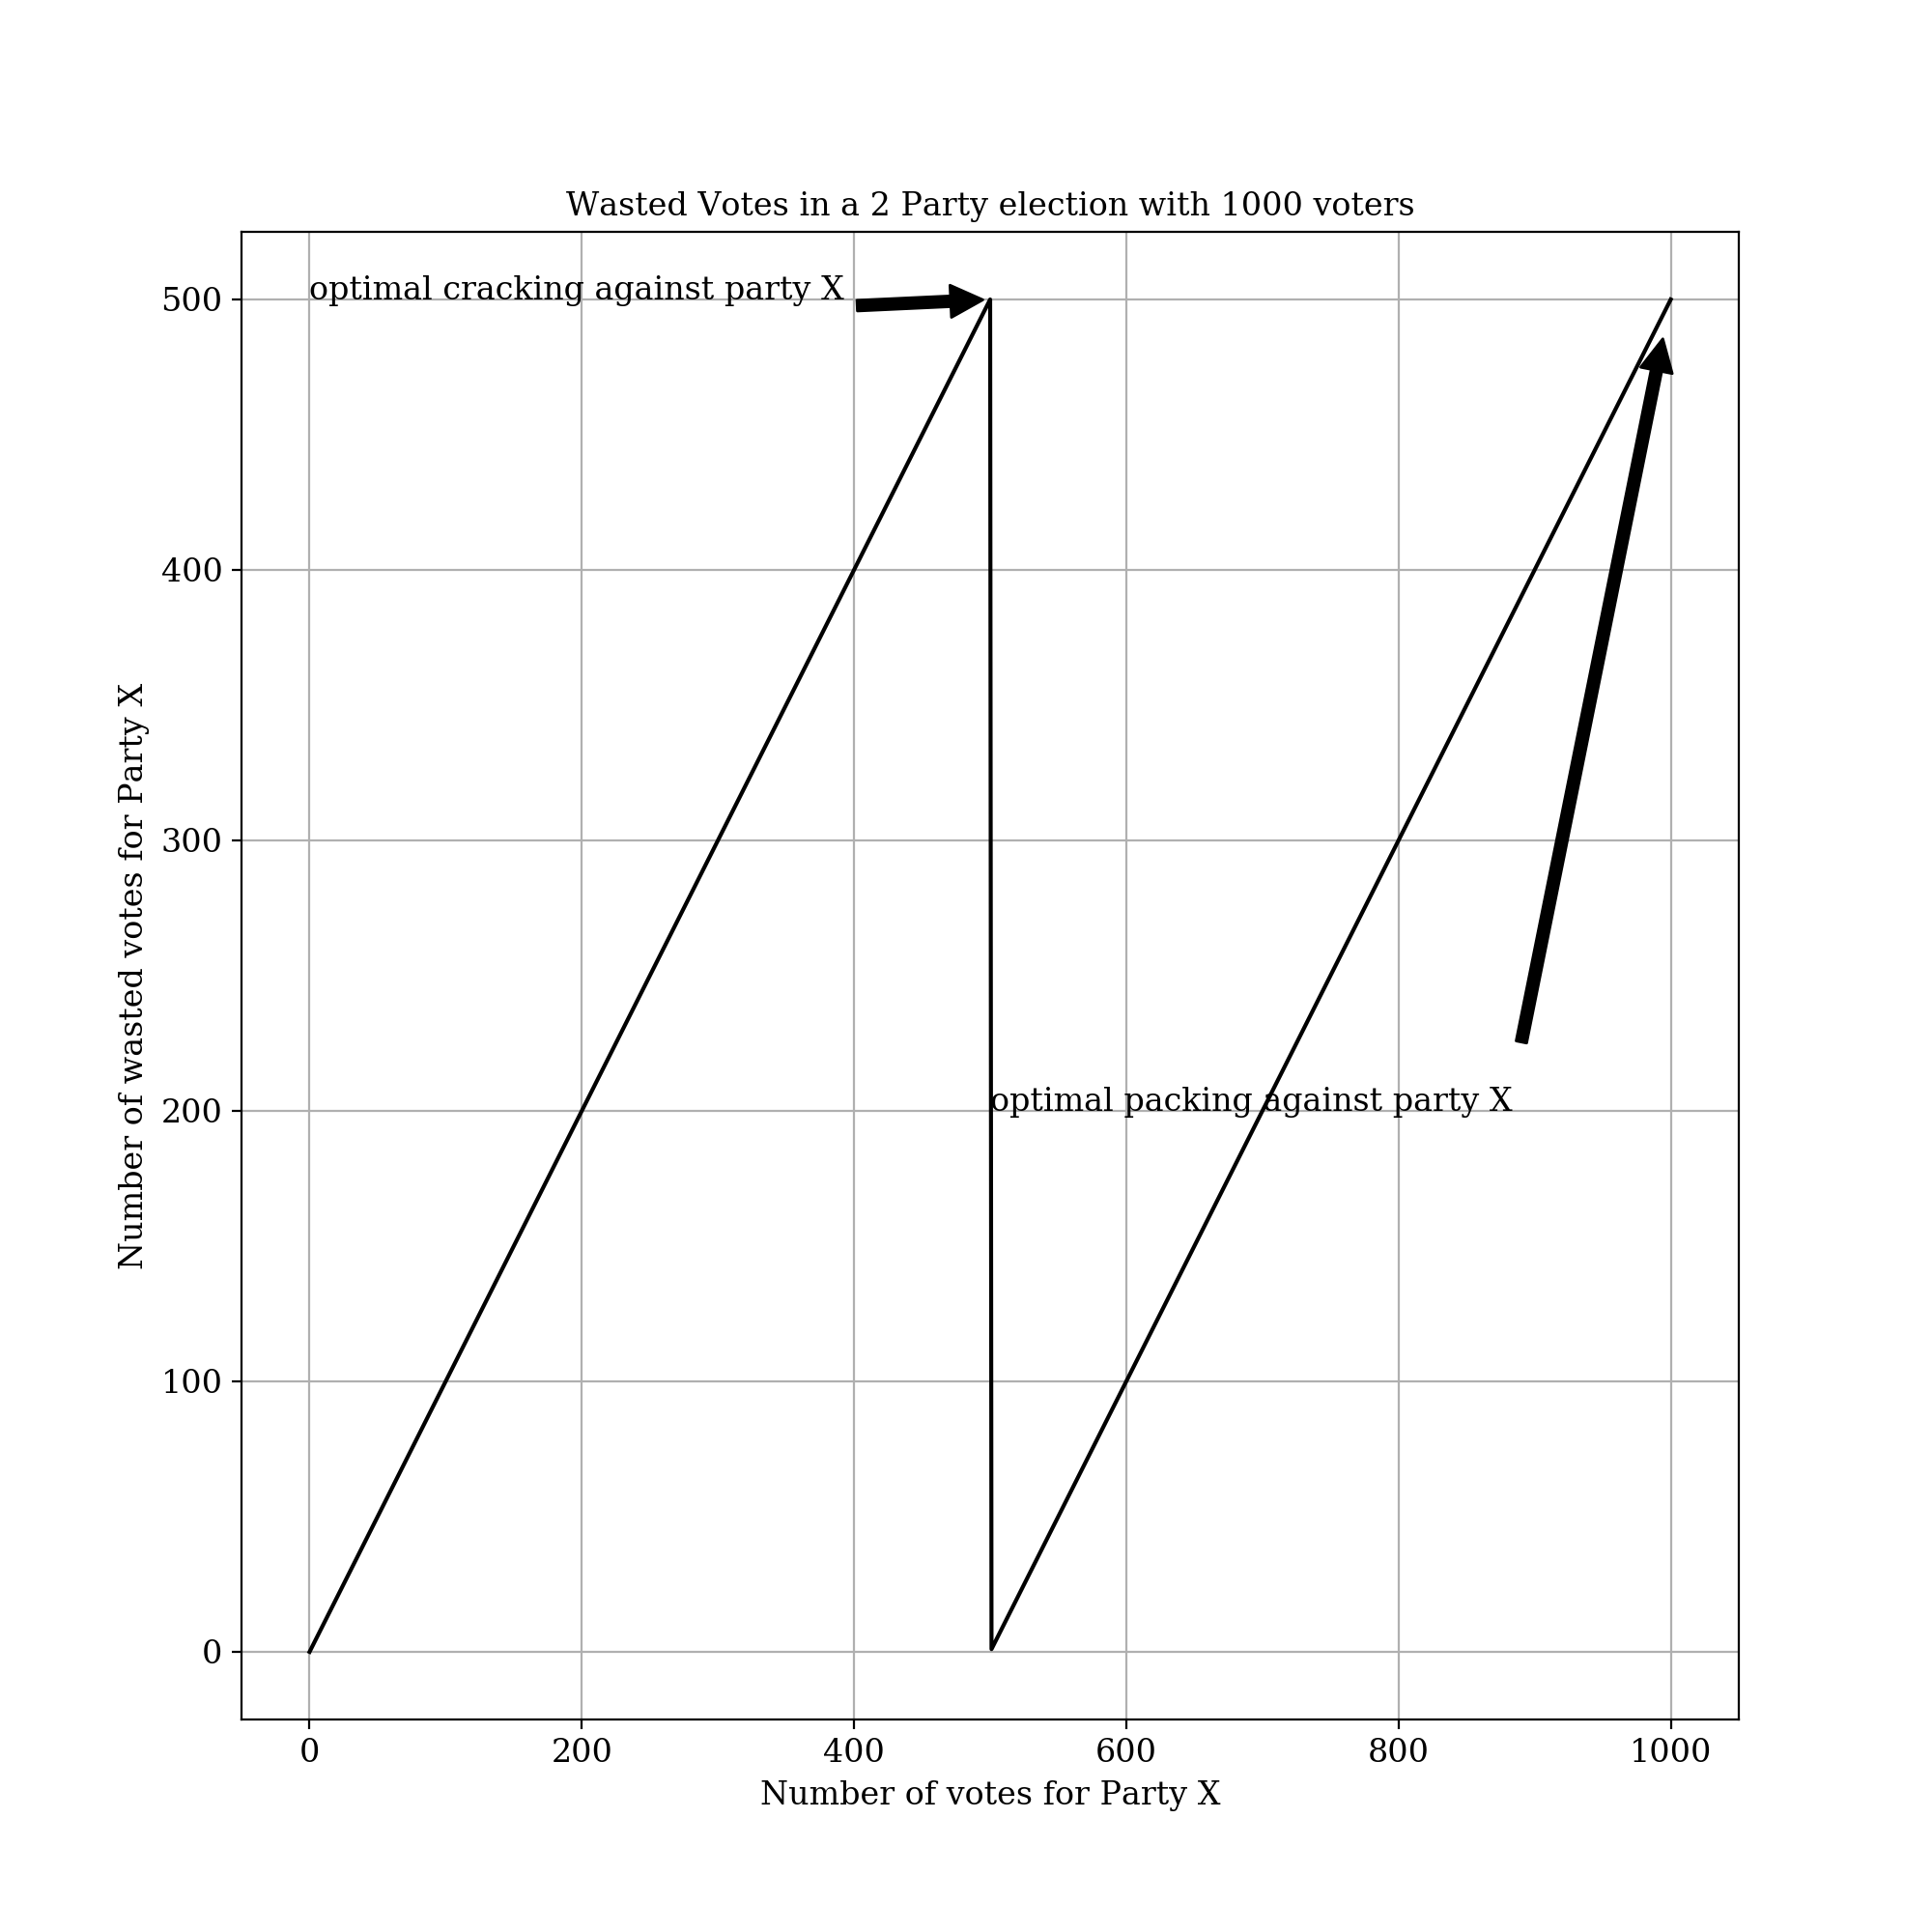
Note that the optimal cracking and packing to waste your opponent’s votes are at 49.9% and 100%, respectively. Basically you want every of your wins you have to be narrow and every loss to be huge.
Efficiency Gap
We calculate the efficiency gap as \(\frac{w_D - w_R}{v_D + v_R}\), where \(w_D\) and \(w_R\) are the number of wasted votes for the Democrats and Republicans, and and \(v_D\) and \(v_R\) are the total number of votes for the Democrats and Republicans. This is the efficiency gap in favor of the Republicans because a higher efficiency factor corresponds to more wastage for the Democrats.
Sounds pretty intuitive, right? Here’s why it makes no sense.
Let’s say you have a state with 100 voters and 20 districts. In this state, 80 voters are Republicans. The Republicans tries to arrange it such that they win all the seats instead of the 80 you’d expect them to win. And let’s say they do it the simple way, by cracking the 20% Democratic vote equally among all the districts (as above) so they have 80% of the vote in every district. Therefore, 30% of votes are wasted Republican votes (80% - 50%) and 20% of votes are wasted Democratic votes (they waste all their votes). This means that the efficiency gap is 10% in favor of the Democrats.
What?
Efficiency Percentage Gap
The issue here is that the efficiency gap breaks down when there is a large difference between the vote totals of the two parties. To compensate, we can divide before subtracting rather than after. To ensure we have the same range of -50% to 50%2, we divide by 2. We thus end up with the formula \(\frac12\left (\frac{w_X}{v_X} - \frac{w_Y}{v_Y}\right)\).
If we use the above example, we get that 37.5% of the Republican votes are wasted (30%/80%) and 100% of the Democratic votes are wasted (20%/20%). Thus, we have an efficiency gap of 31.3% in favor of the Republicans, as you might expect.
Does this make a difference when calculated against practical data?3
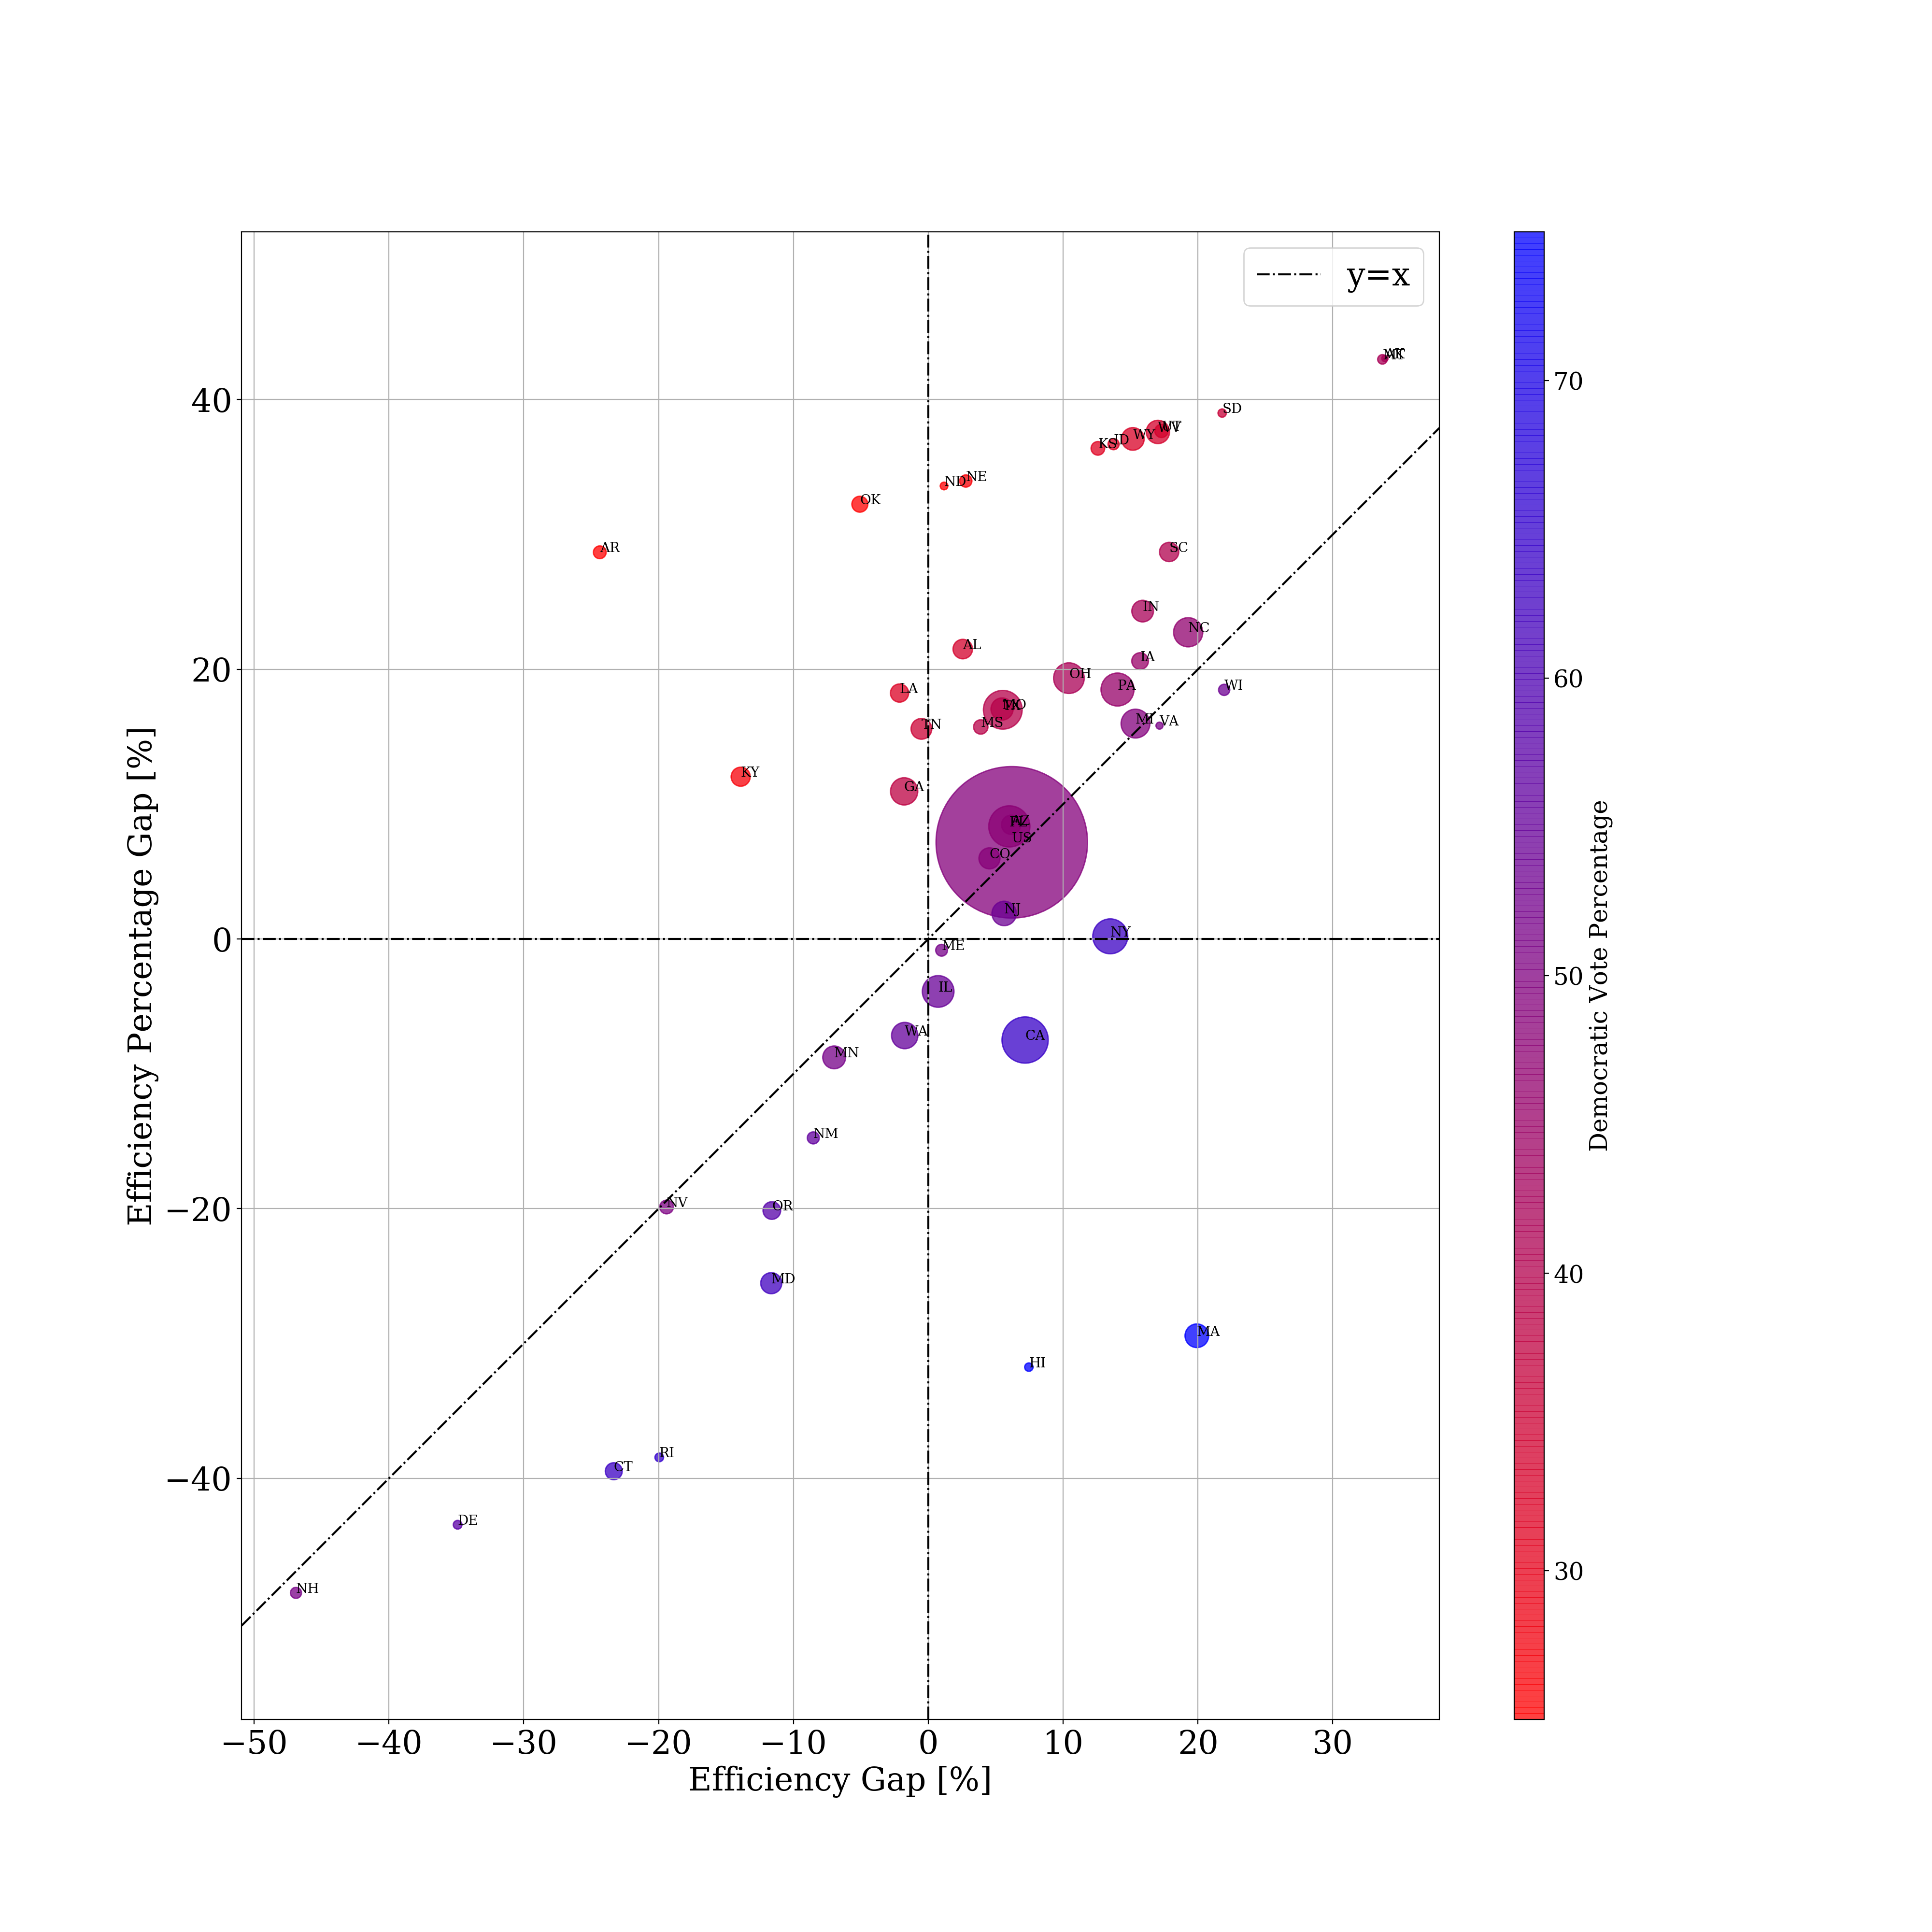
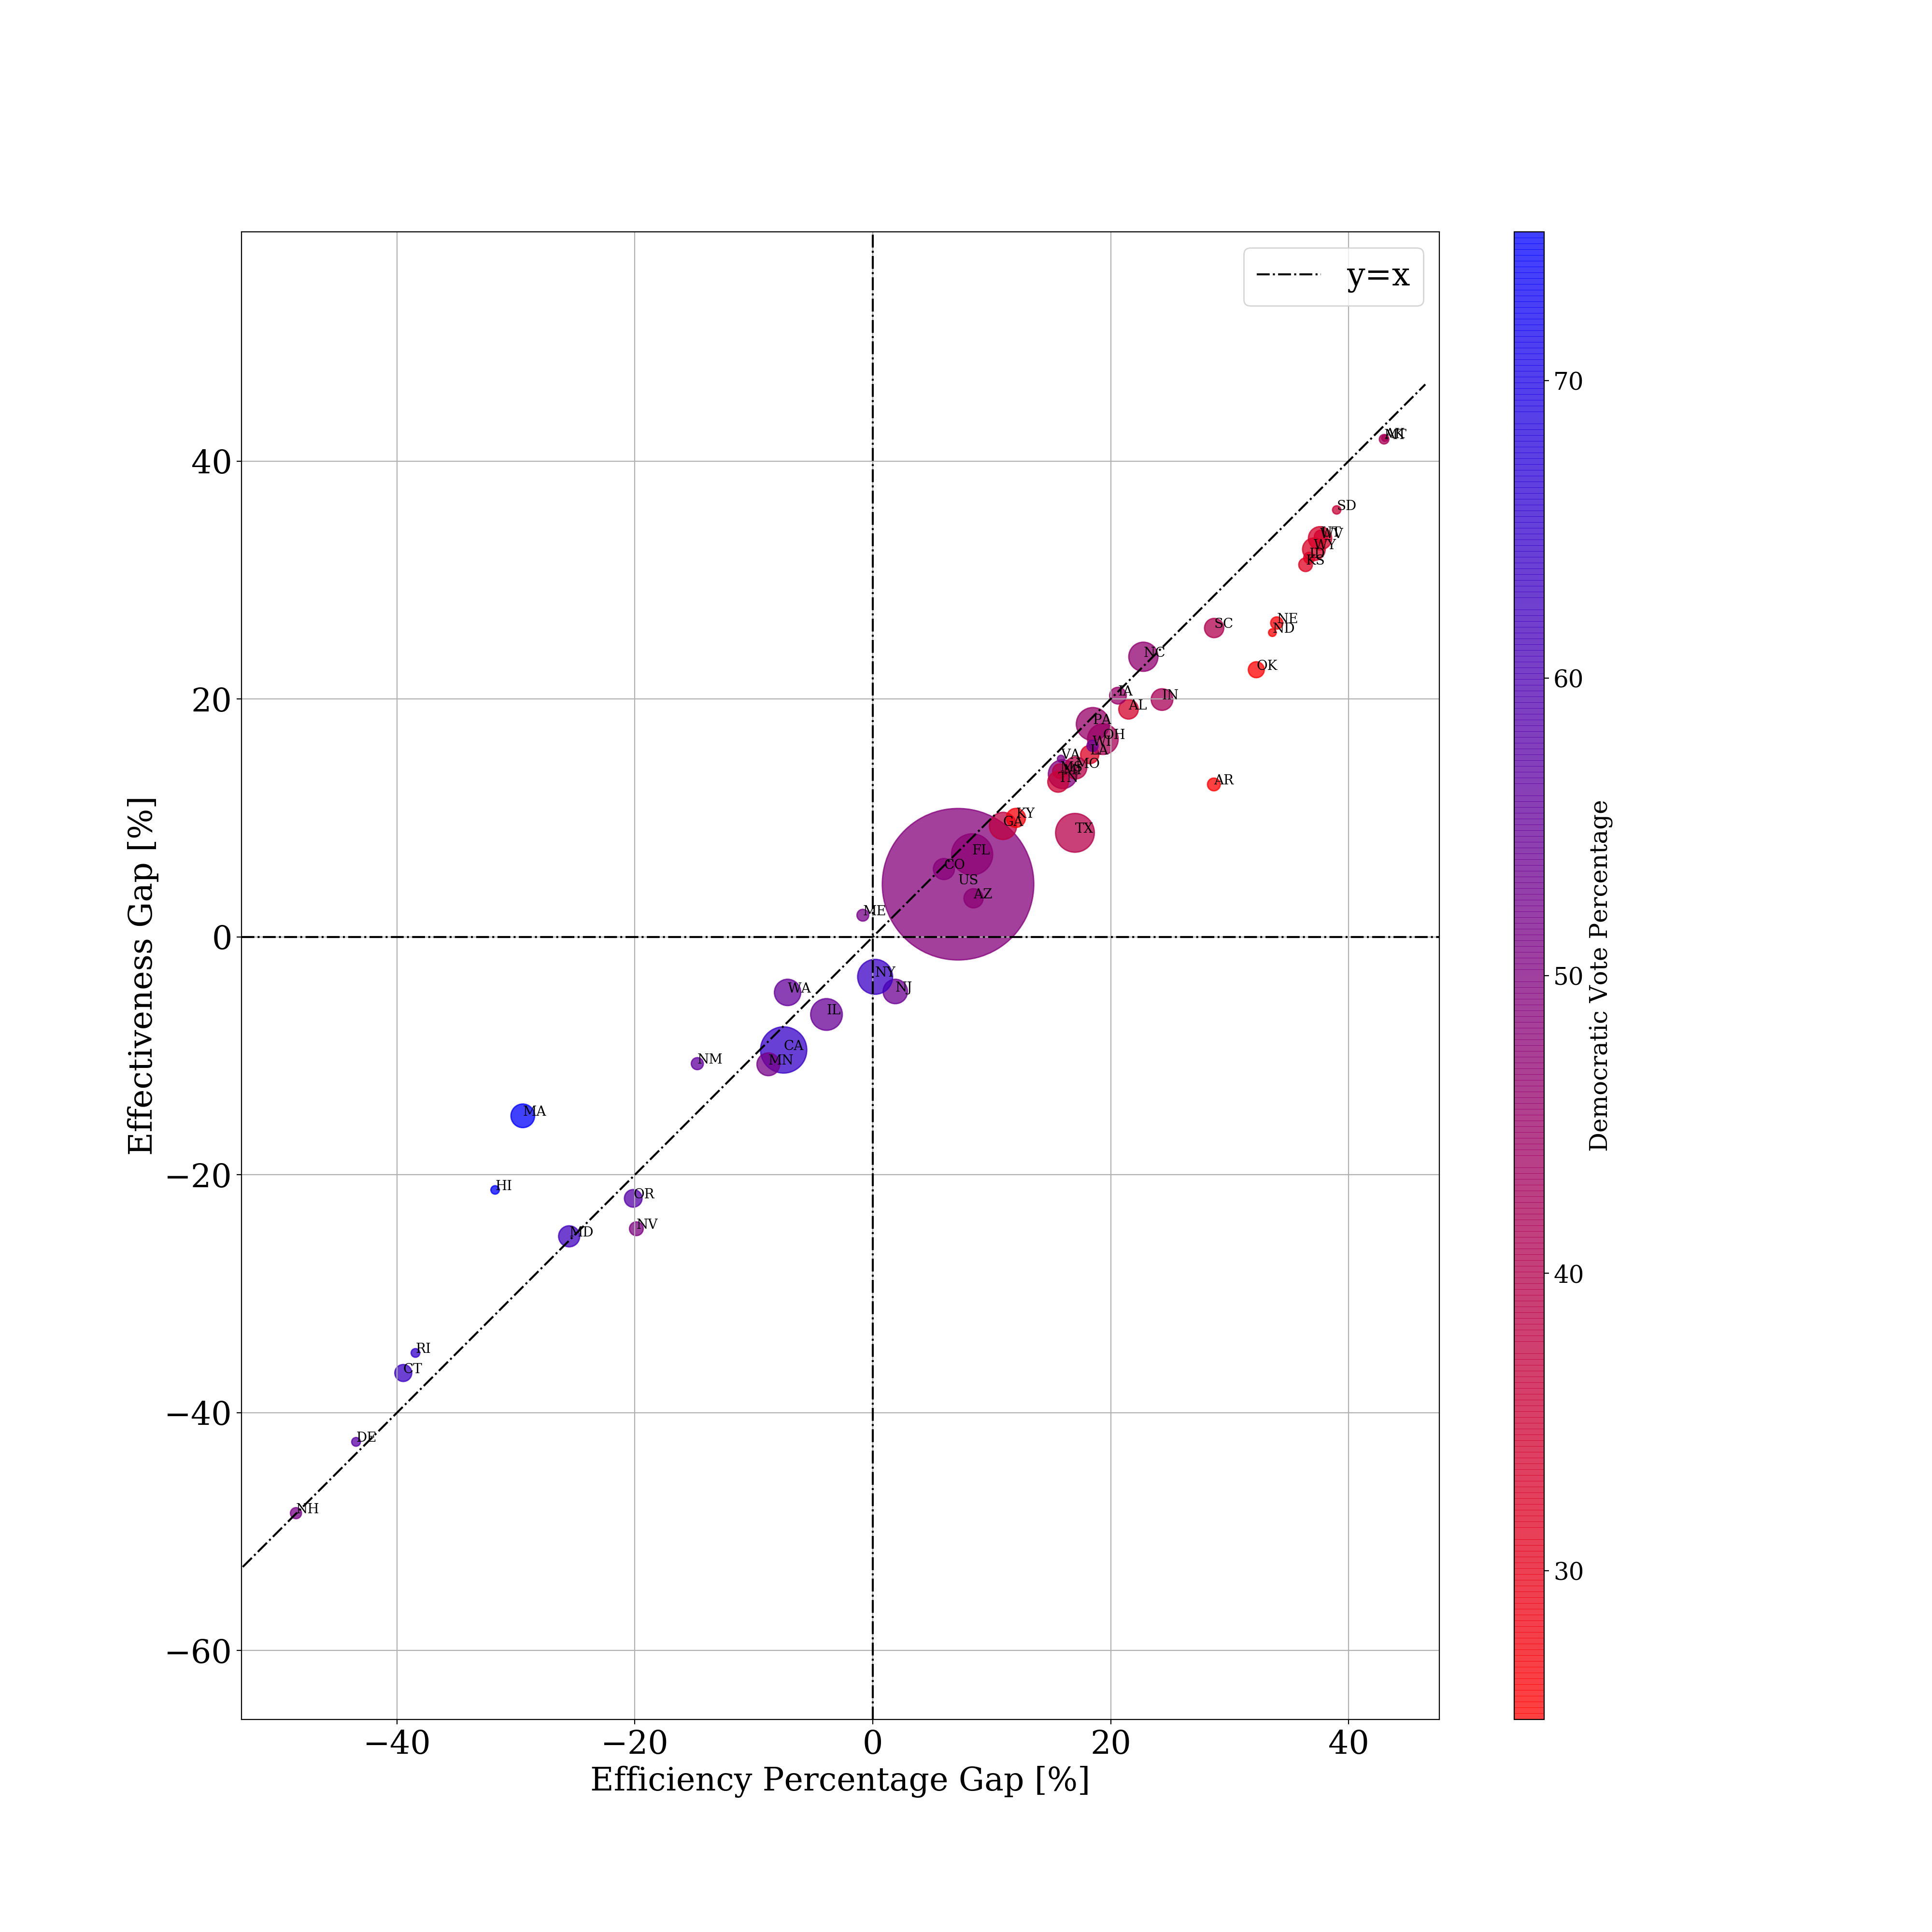
This graph plots the gap towards the Republicans on both metrics. For example, Maryland is on the bottom left as a state gerrymandered in favor of the Democrats while North Carolina is on the top right as a state gerrymandered in favor of the Republicans.
Regardless of which metric we use, the general trend remains. Blue states tend to be gerrymandered blue while red states tend to be gerrymandered red, but there’s a clear winner: the Republicans, who seem to have gerrymandered most of the purple states and thus have gerrymandered the entire US (the largest circle).
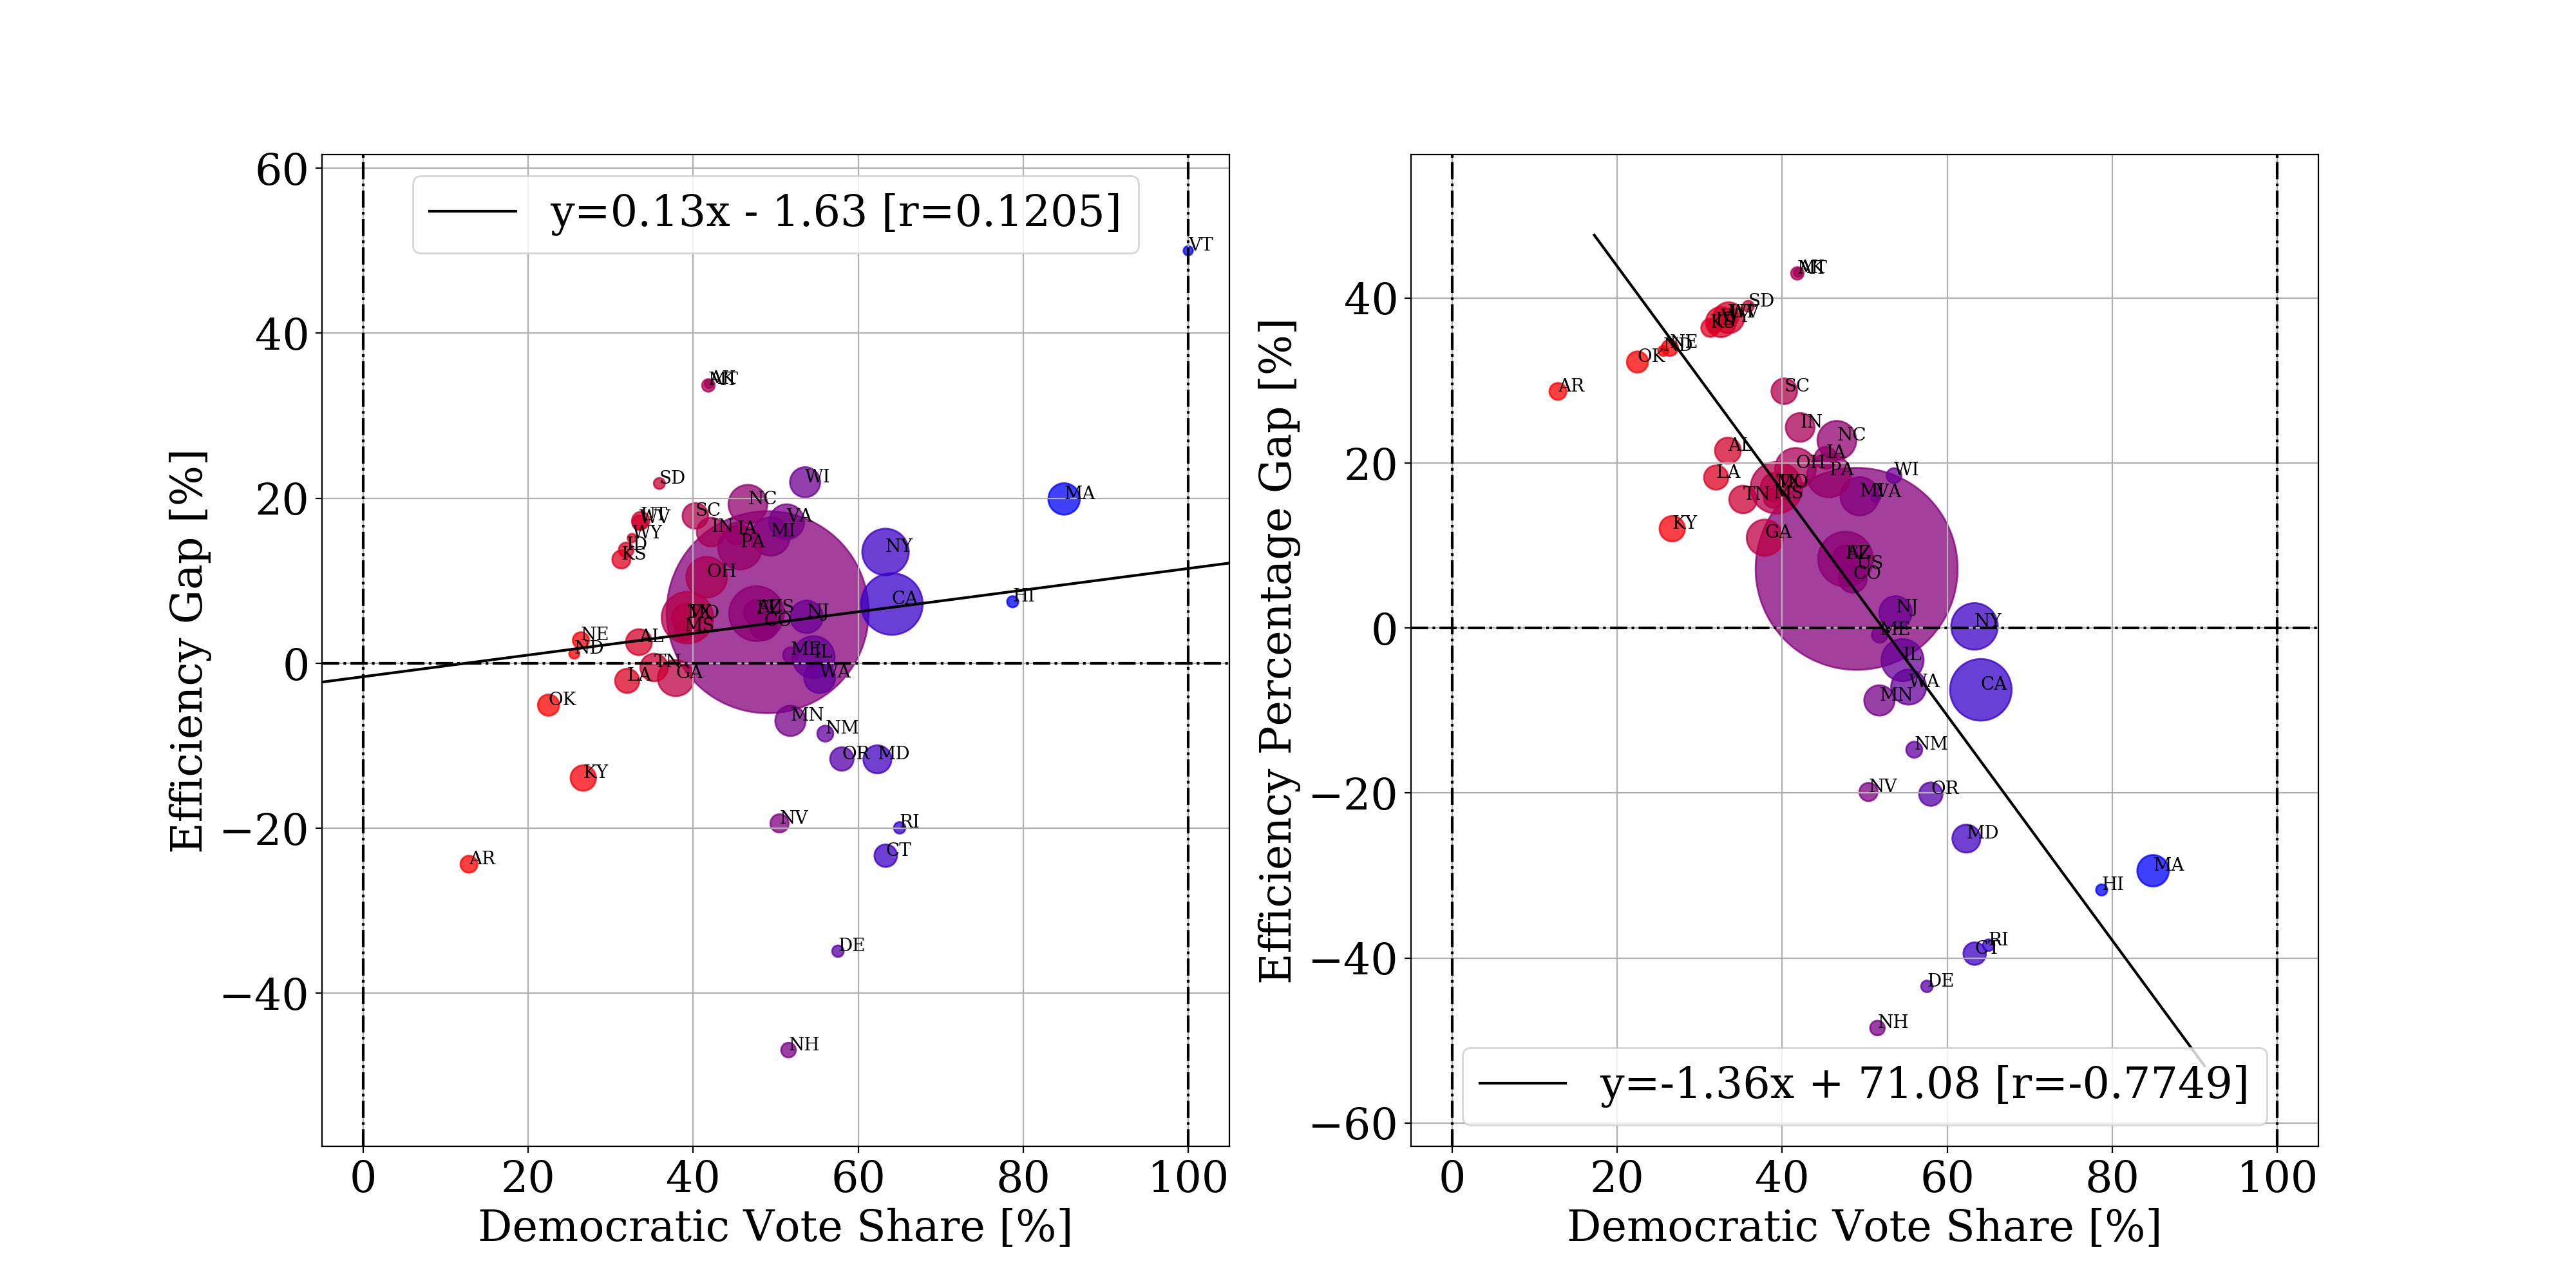
Using the efficiency percentage gap does in fact make a difference in lopsided cases like the hypothetical 80% Republican state. Note that states that have a Democratic-leaning efficiency gap but a Republican leaning efficiency percentage gap are red states (Arkansas, Kentucky) while states that have the opposite difference tend to be Democratic states (Massachusetts, Hawaii). In general, states that are below the line (more Republican leaning efficiency gap than Republican leaning efficiency percentage gap) tend to be blue states while states above the line tend to be red states.
In fact, party affiliation correlates more heavily with the efficiency percentage gap than with the efficiency gap, suggesting that it’s a better model for measuring gerrymandering.
Effectiveness gap
Remember our example with the highly partisan state? We said that the Republicans deserved 80% of the seats since they held 80% of the votes. Why not just base a gerrymandering measure on just subtracting the percentage of captured seats from the percentage of won votes?
I call this measure the “effectiveness gap” because rather than measuring efficiency (wasted votes) it directly measures the effectiveness of a map in producing seats for one party or another.
In our example, the Republicans got 80% of the votes but 100% of the seats, so there was a 20% effectiveness gap in favor of them.4
It turns out that this measure is pretty much the same as the efficiency percentage gap in practice (even though it differed in this theoretical unrealistically lopsided state).
It looks like the efficiency percentage gap tends to somewhat overate the effectiveness gap in highly partisan states, but other than that, they track quite closely.
Potential problems with the effectiveness gap
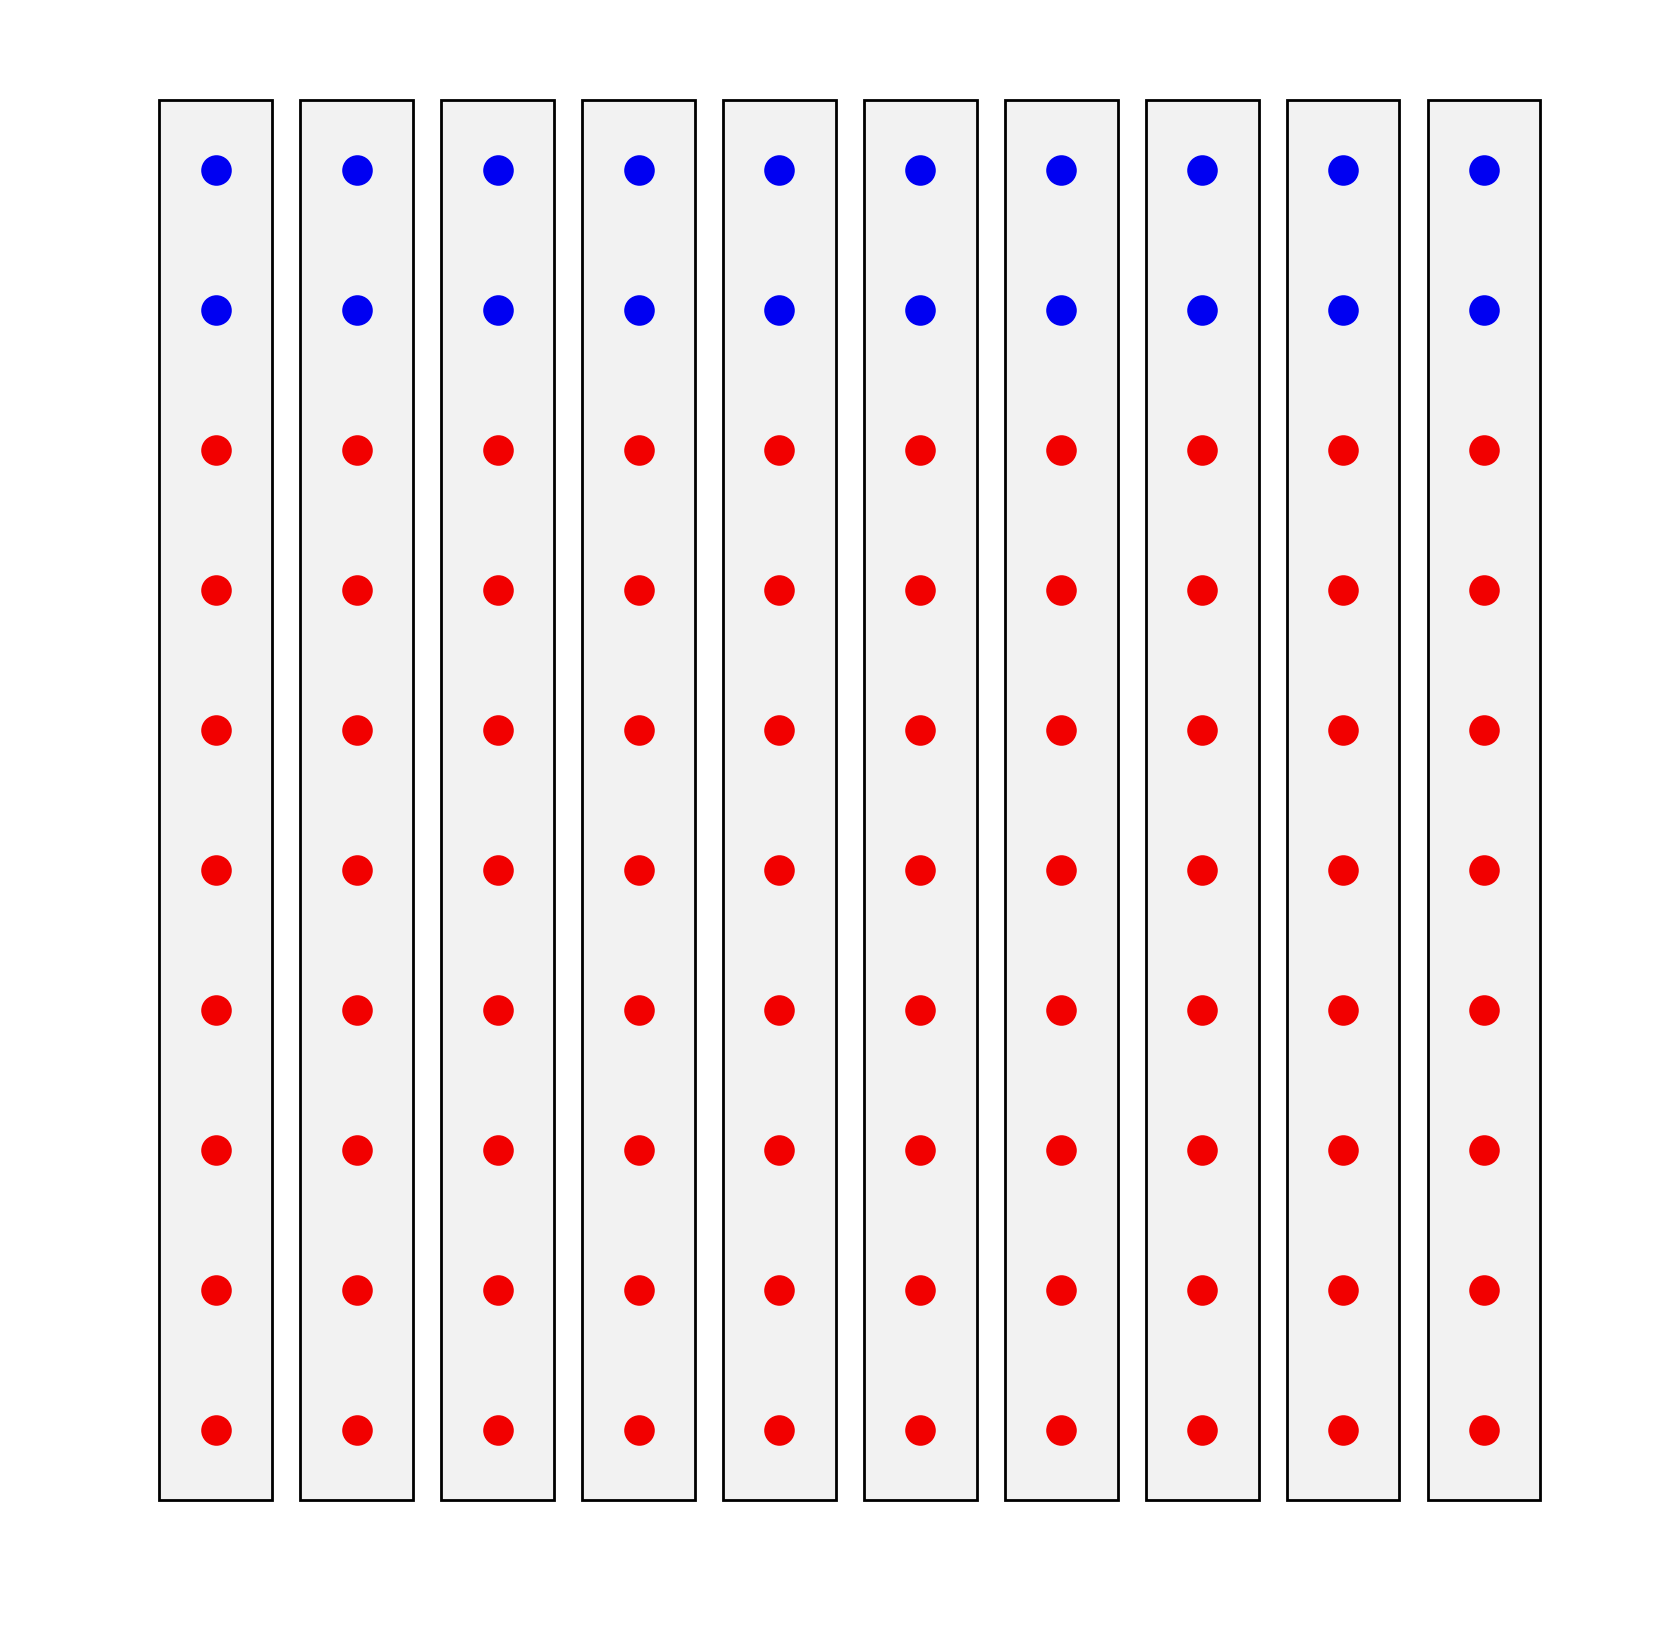
One problem with the effectiveness gap is that it might be somewhat sensitive to turnout differences. For example, take this state which has 100 voters and 10 districts.
In this example, the map is clearly gerrymandered against Republicans, with an effectiveness gap of 64%-40%=24% in favor of Democrats. However, let’s say that non-competitive districts have 50% less turnout. Then we have an overall turnout of 80 votes, of which the Republicans get 44 and the Democrats get 36, for an effectiveness gap of 55%-40% = 15%, a much smaller result.
We can adjust for this effect by acting as if every district had an equal turnout when calculating what percentage of votes a given party received. We call this measure the weighted effectiveness gap. Interestingly, this adjustment seems to have little to no effect on the existing map.
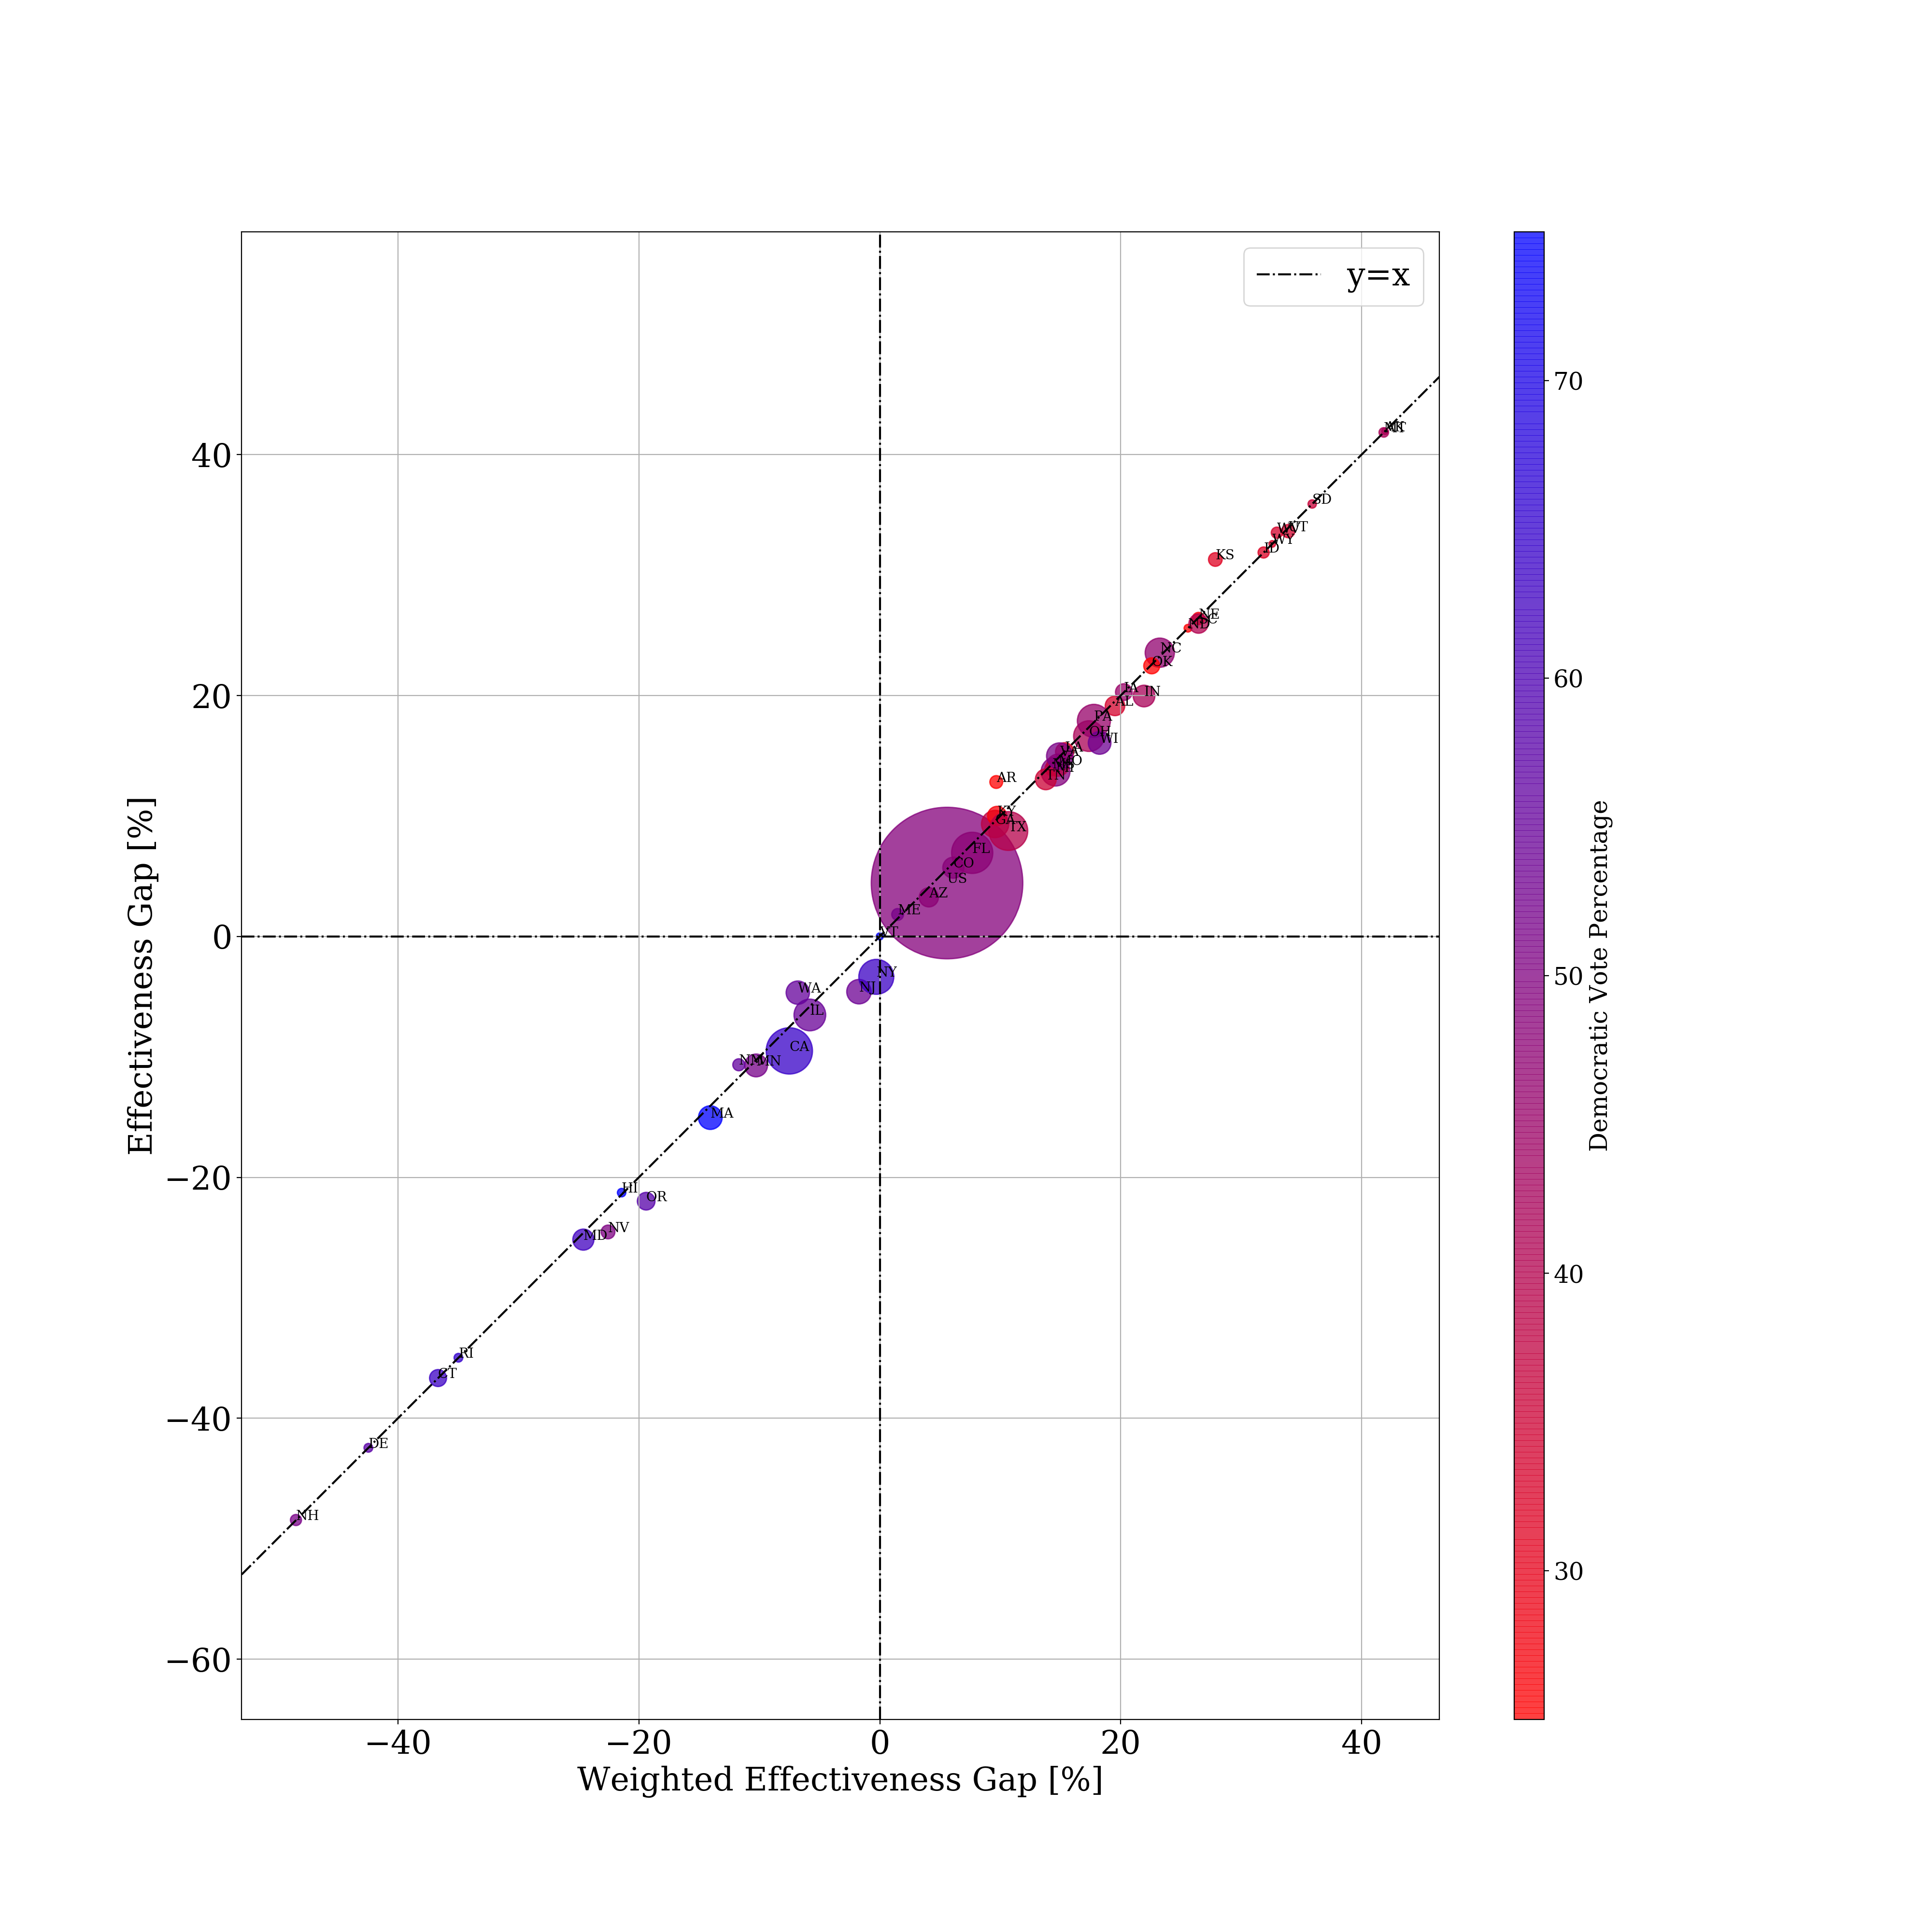
So the effectivenss gap seems to be fairly robust to this potential problem.
Why use the efficiency gap?
My honest answer is that I have no idea. I don’t see any reason why political scientists seem to prefer it over the (to me) much more intuitive effectiveness gap. There doesn’t seem to be any political reason since both models give the same high level picture of mostly-Republican though some Democratic gerrymandering. My only possible explanation is that the efficiency gap appears to more closely measure gerrymandering since it explicitly measures packing and cracking. However, the efficiency percentage gap also does that, so I’m not sure that’s the right explanation.
Anyway, if you’re a political scientist, know the explanation for this, and feel generous with your time, you can contact me at my first name @berkeley.edu.
-
The United States has two political parties. A vote for the Green, Libertarian, or American Independent Party is a wasted vote. But if you’re voting for the AIP (the party that nominated Wallace), you should waste your vote, so I guess I’m fine if you vote for the AIP. ↩
-
A minimum of 0% maximum of 50% of the total vote count can be wasted on either party. Thus the efficiency will always be somewhere between -50% and 50%. On the other hand, a party can waste 100% of it’s votes if it loses every seat and 0% if it barely wins every seat, so the efficiency percentage gap is found in the range -100% to 100%. ↩
-
I used raw data from this data source to calculate the total Democratic and Republican vote totals for every house race in 2016. I treated any uncontested races as if they were races in which the other party got 0 votes. I also just ignored all independents, even if they might have clearly had some affiliation. ↩
-
There’s no need to normalize by a factor of 2 because a party can’t increase it’s number of seats by more than 50% points through gerrymandering. At best, it can barely win every district it wins, doubling it’s representation. Thus, optimally, a party with just over 50% can control every seat, for a gain of 50%. A symmetric argument works for loss, so we have that the effectiveness gap is in the range of -50% to 50%. ↩