Setting the actual size of figures in matplotlib.pyplot
Let’s say you want to set the size of a figure in matplotlib, say because you want the captions to match the font size on a poster (this came up for me recently). However, you might find yourself with kinda a weird problem.
Directly setting the size of a figure
Setting the actual size of figures in matplotlib.pyplot is difficult. Setting the size of a figure as so
plt.figure(figsize=(5, 2.5))
plt.plot([1, 2, 3], [4, 5, 6])
plt.xlabel("x label")
plt.ylabel("y label")
plt.savefig("direct.png")
print(imread("direct.png").shape) # outputs (250, 500, 4)
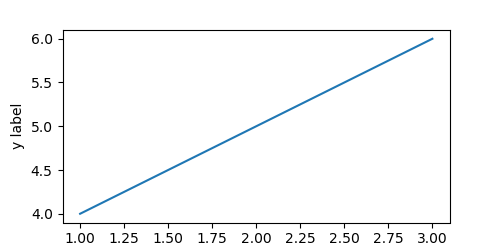
It’s the right size in pixels, except that this image is padded weirdly and the x label is cut off (border added).
Tight Layout
The fix for this is to use a tight layout in the output
plt.figure(figsize=(5, 2.5))
plt.plot([1, 2, 3], [4, 5, 6])
plt.xlabel("x label")
plt.ylabel("y label")
plt.savefig("tight-layout.png", bbox_inches='tight')
print(imread("tight-layout.png").shape) # outputs (259, 462, 4)
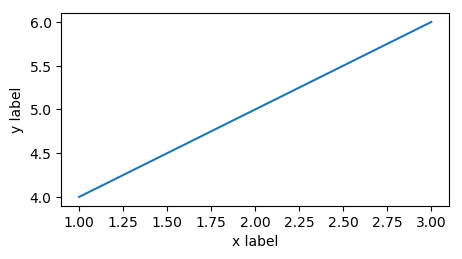
This fixes the elements being dropped issue, but the image size is now incorrect (at 2.59x4.62 instead of 2.5x5).
Fixing the problem
First, we write a general function to get the size of a figure. We then calculate \(x_{\text{to set}} = x_{\text{set previously}} \frac{x_{\text{target}}}{x_{\text{actual}}}\) for \(x\) being the width and height. The intuition behind this equation is that we figure out how off the actual image’s size is from our target, and use this to update what we tell matplotlib to do.
However, this is an approximation, and we repeat it to get a better fit. The full code is below:
from matplotlib.image import imread
from tempfile import NamedTemporaryFile

def get_size(fig, dpi=100):
    with NamedTemporaryFile(suffix='.png') as f:
        fig.savefig(f.name, bbox_inches='tight', dpi=dpi)
        height, width, _channels = imread(f.name).shape
        return width / dpi, height / dpi

def set_size(fig, size, dpi=100, eps=1e-2, give_up=2, min_size_px=10):
    target_width, target_height = size
    set_width, set_height = target_width, target_height # reasonable starting point
    deltas = [] # how far we have
    while True:
        fig.set_size_inches([set_width, set_height])
        actual_width, actual_height = get_size(fig, dpi=dpi)
        set_width *= target_width / actual_width
        set_height *= target_height / actual_height
        deltas.append(abs(actual_width - target_width) + abs(actual_height - target_height))
        if deltas[-1] < eps:
            return True
        if len(deltas) > give_up and sorted(deltas[-give_up:]) == deltas[-give_up:]:
            return False
        if set_width * dpi < min_size_px or set_height * dpi < min_size_px:
            return False
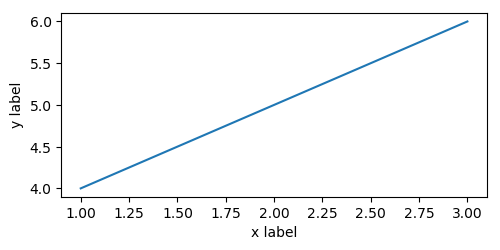
Using this method (note that we no longer need to set the figure size when creating the figure)
fig = plt.figure()
fig.gca().plot([1, 2, 3], [4, 5, 6])
plt.gca().set_xlabel("x label")
plt.gca().set_ylabel("y label")
set_size(fig, (5, 2.5))
plt.savefig("update-size.png", bbox_inches='tight')
print(imread("update-size.png").shape) # outputs (250, 500, 4)
we get the following result, which is exactly the correct size.
What’s with the return False?
The reason that we check to see if the error is increasing is that sometimes it is impossible to fit a plot within a given space. For example, take the following example
fig = plt.figure()
fig.gca().plot([1, 2, 3], [4, 5, 6])
plt.gca().set_xlabel("x label")
plt.gca().set_ylabel("y label")
set_size(fig, (5, 2.5))
plt.savefig("update-size.png", bbox_inches='tight')
print(imread("update-size.png").shape) # outputs (250, 500, 4)
This ends up trying to decrease the height of the figure to below 0, but before it can cause a crash in matplotlib, it causes the last condition in set_size to be activated, leading to a False return value. The resulting image is 91x109, nowhere close to the 100x50 that it should be, and looks like this
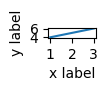
By returning False, this allows e.g., a notebook to finish executing in cases where it is unecessary to check, but a simple assert set_size(fig, (1, 0.5)) would lead to an error if that is desired.
Conclusion
The example above is full, working, code, and should honestly probably be part of matplotlib: generally speaking, when I set the size of a figure, I intend to set the actual size of the figure, not the size of the plot with some minimal padding around it. In any case, hopefully this code is helpful to you!